 DE
DE  EN
EN You got stuck in your implementation and need help?
For installation problems, please have a look into the Installation Manuals.
If you have problems with your configuration it's worth to have a look at our extensively described Examples. Maybe you find the solution there.
If you still need help please follow those steps, our experience tells us, that 90% of all questions from our side could be answered, looking simply into your files.
Windows Installation:
- Set W-ELP into debug mode: Start ELP Control Center -> Open Configuration Tab -> Click button Rule assistant -> Click on the checkbox debugging top left and follow the steps described below.
- NOTE: Sometimes in the documentation (Self-training) you are asked to capture a data stream. In that case you simply need to enable the protocol.
However, then the log_mode=101, which will cause a big loss of performance. So please remove the log_mode key after enabling debugging in the rule assistant after returning to the main Configuration Tab.
Steps for MS Windows platforms:
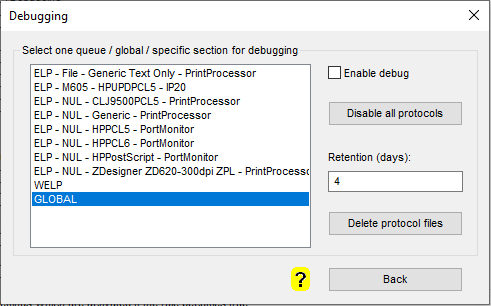
- Select the printer queue which you want to debug (or global for all queues).
- Click the checkbox "Enable debug" if it's not enabled yet.
- Set the protocol retention days:
- This will create a scheduled tasks which deletes all protocol files. The scheduled task will be automatically deleted when you disable the protocol from within this dialog.
- Please use a positive value. 0 will delete all files immediately which does not make any sense. So it should be between 1 and 10000 (about 27 years). A typical value is 7.
- If you enter an invalid value (e.g. non-numeric), W-ELP will set the value automatically to 0.
- Use the Back Button and send your test data stream to the printer queue (if you didn't print with debug mode enabled already)
- Afterwards please turn the debugging function OFF as it can consume quite a lot of system resources.
Hints:
- You can create a so called Diagnostics Bundle which includes the captured spool files and all W-ELP configuration files.
- The Debug output will be stored in the subfolder .\Debug\<PRINTERNAME> of the Workpath (the default is c:\ProgramData\WELP)
- This function, beside the Archive-Function, can perfectly be used to collect and reprint data stream without the need of the application. You may copy the spool file <WORKPATH>\Debug\<PRINTERNAME>In_Data_<DATESERIAL>.prn into the W-ELP program folder (admin rights needed for that task) and rename with a .pcl suffix, e.g. Invoice.pcl. For reprinting open the Install Register Tab, right mouse click on the activated queue name and select "Send a test data stream" or use the button "Print demo file on selected printer".
Steps for Unix/Linux users:
-
If you use ELP only for Barcode printing, you may not have a start-up ini file defined. To check, please open your shell script and check for the -c and -d command line parameters.
-
If missing: please read the installation manual. -c/.../convert.ini and -d/... The path ... is in most implementations the same. Make also sure that all users and printing processes have write and create access to that directory.
-
Then add to the convert.ini, rule GLOBAL those keys, or change the provided ones:
Log_Mode=101
Debug_OutData=ON
Debug_InData=ON -
Reprint the job once and check if the debug files: in_data.prn, out_data.prn and log_file.txt had been created. If not, then ELP did either not find the convert.ini file, or was not called.
-
To find out if ELP was executed, maybe add a new command line to your shell script: ECHO "ELP was executed" > /.../test.txt
-
Call the shell script once and check if the file is generated, delete it and try to print again from your application. If the test.txt file is not there, the shell script was not called or you have access problems. Otherwise if the ELP protocol files are still missing, the -c and/or -d parameter could be wrong typed in the command line.
-
If all files are available please do not forget to revert the changes done in the convert.ini.
If we need to review your installation online we are able to do that with your preferred screen sharing tool which is allowed by your security department. Our standard supported tools for this purpose are TeamViewer, GoTo (GoToMeeting) or Microsoft Teams. The latter must have the "give control" feature enabled by your Microsoft 365 admin. If none of these are possible, please contact us before the meeting to agree on an alternative remote meeting tool like HopToDesk, RustDesk, AnyDesk, WebEx, Zoom, etc.
Related articles: Rule Assistant, More Debug Options, Font Analysis, Glyph Table Creation